Data-driven agency decisions
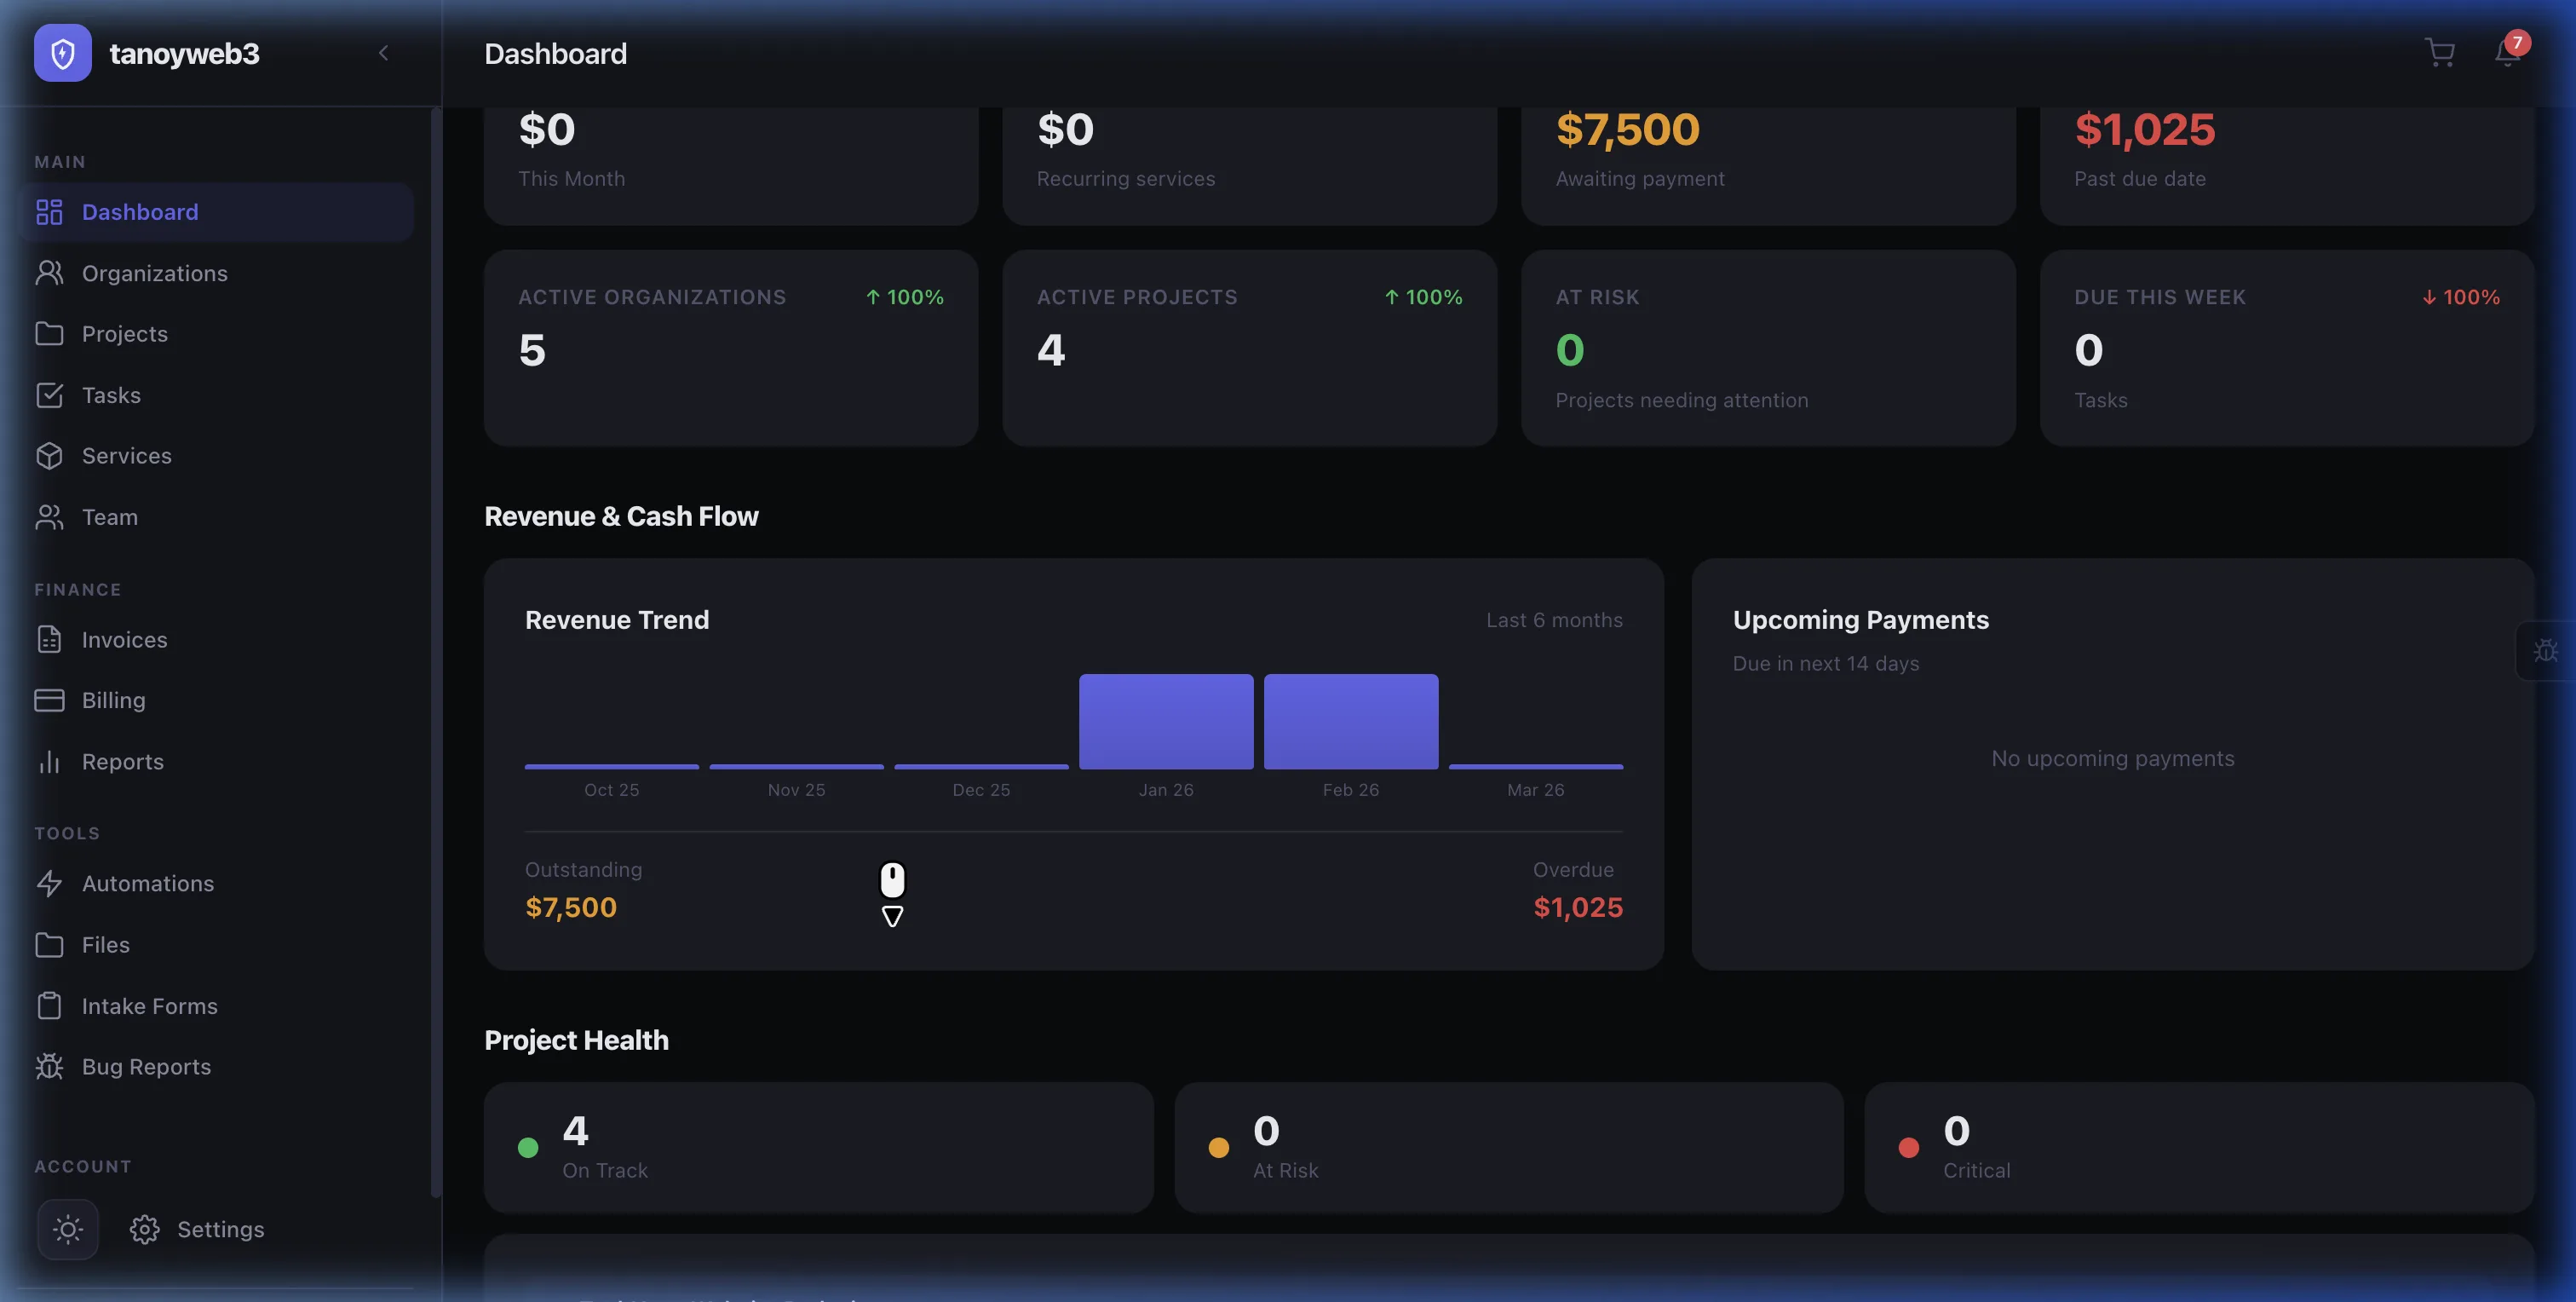
Revenue KPIs, project health, task analytics, time tracking, and team workload — real-time dashboards that tell you exactly where your agency stands.
Loved by agencies
"The revenue dashboard finally gives us the confidence to forecast accurately. We spotted an underperforming client segment within the first week."
Built for teams like yours
Agency Owners
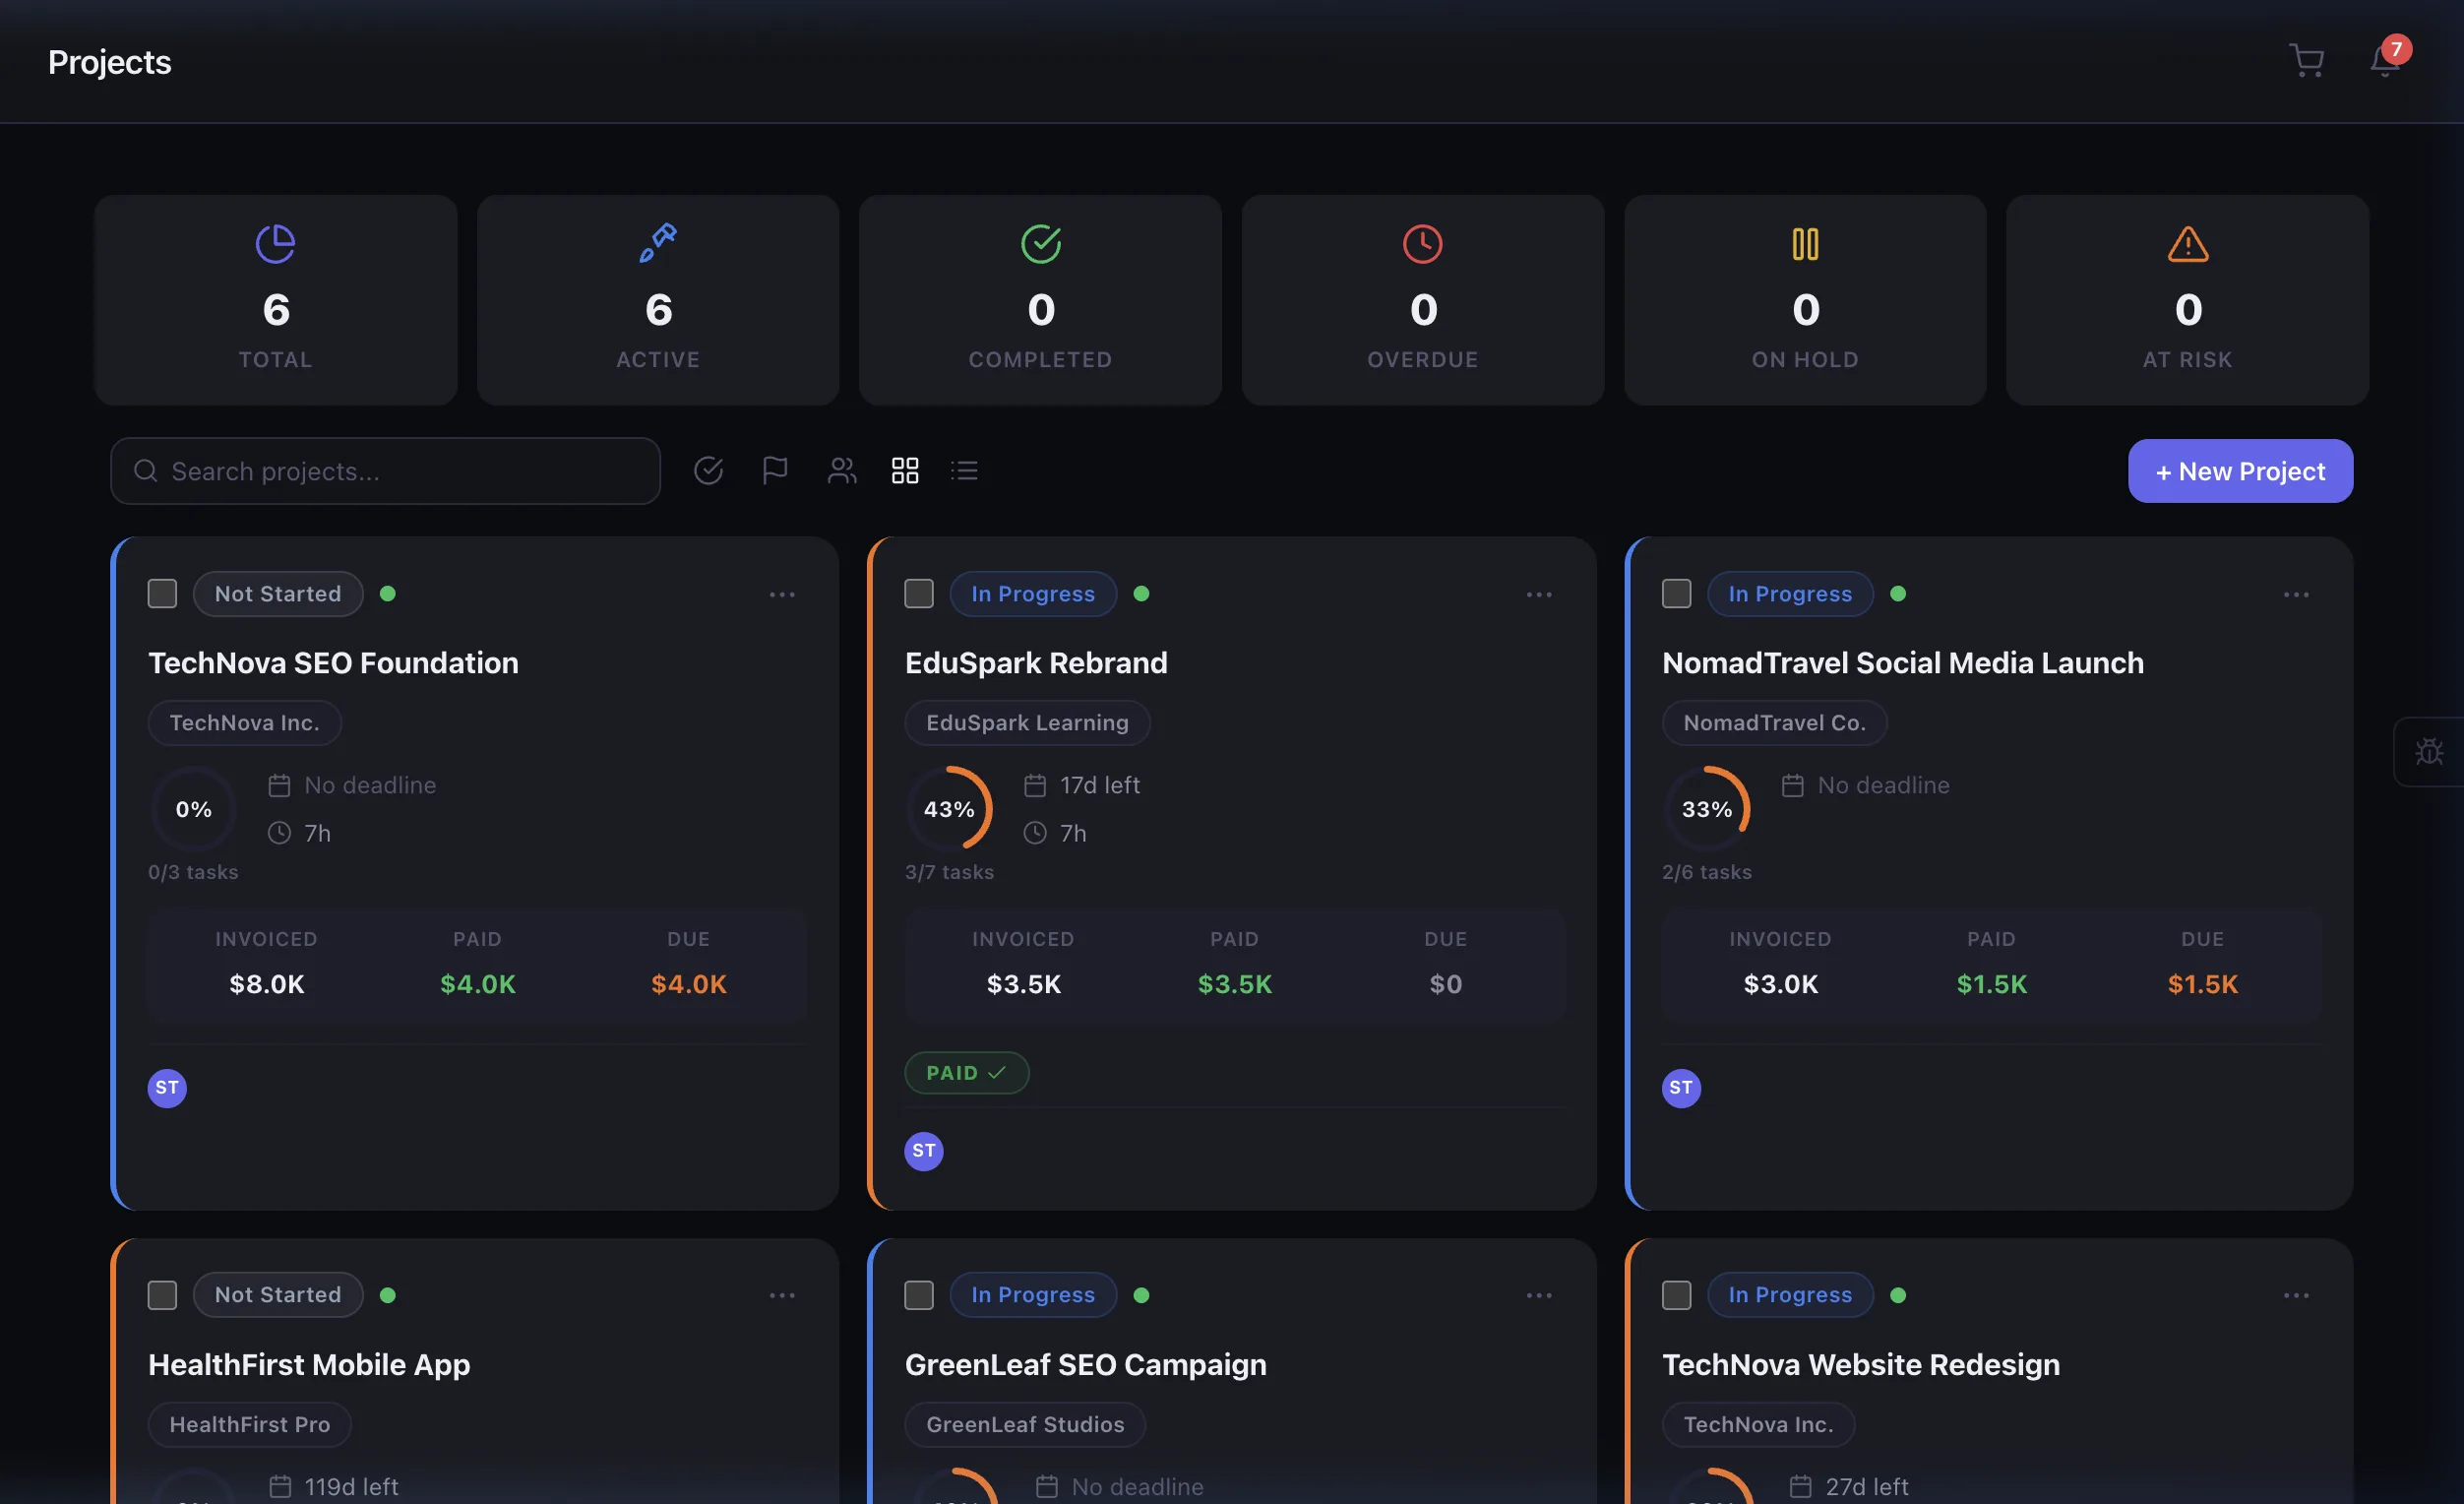
Revenue trends, profitability, and client lifetime value at a glance.
Team Leads
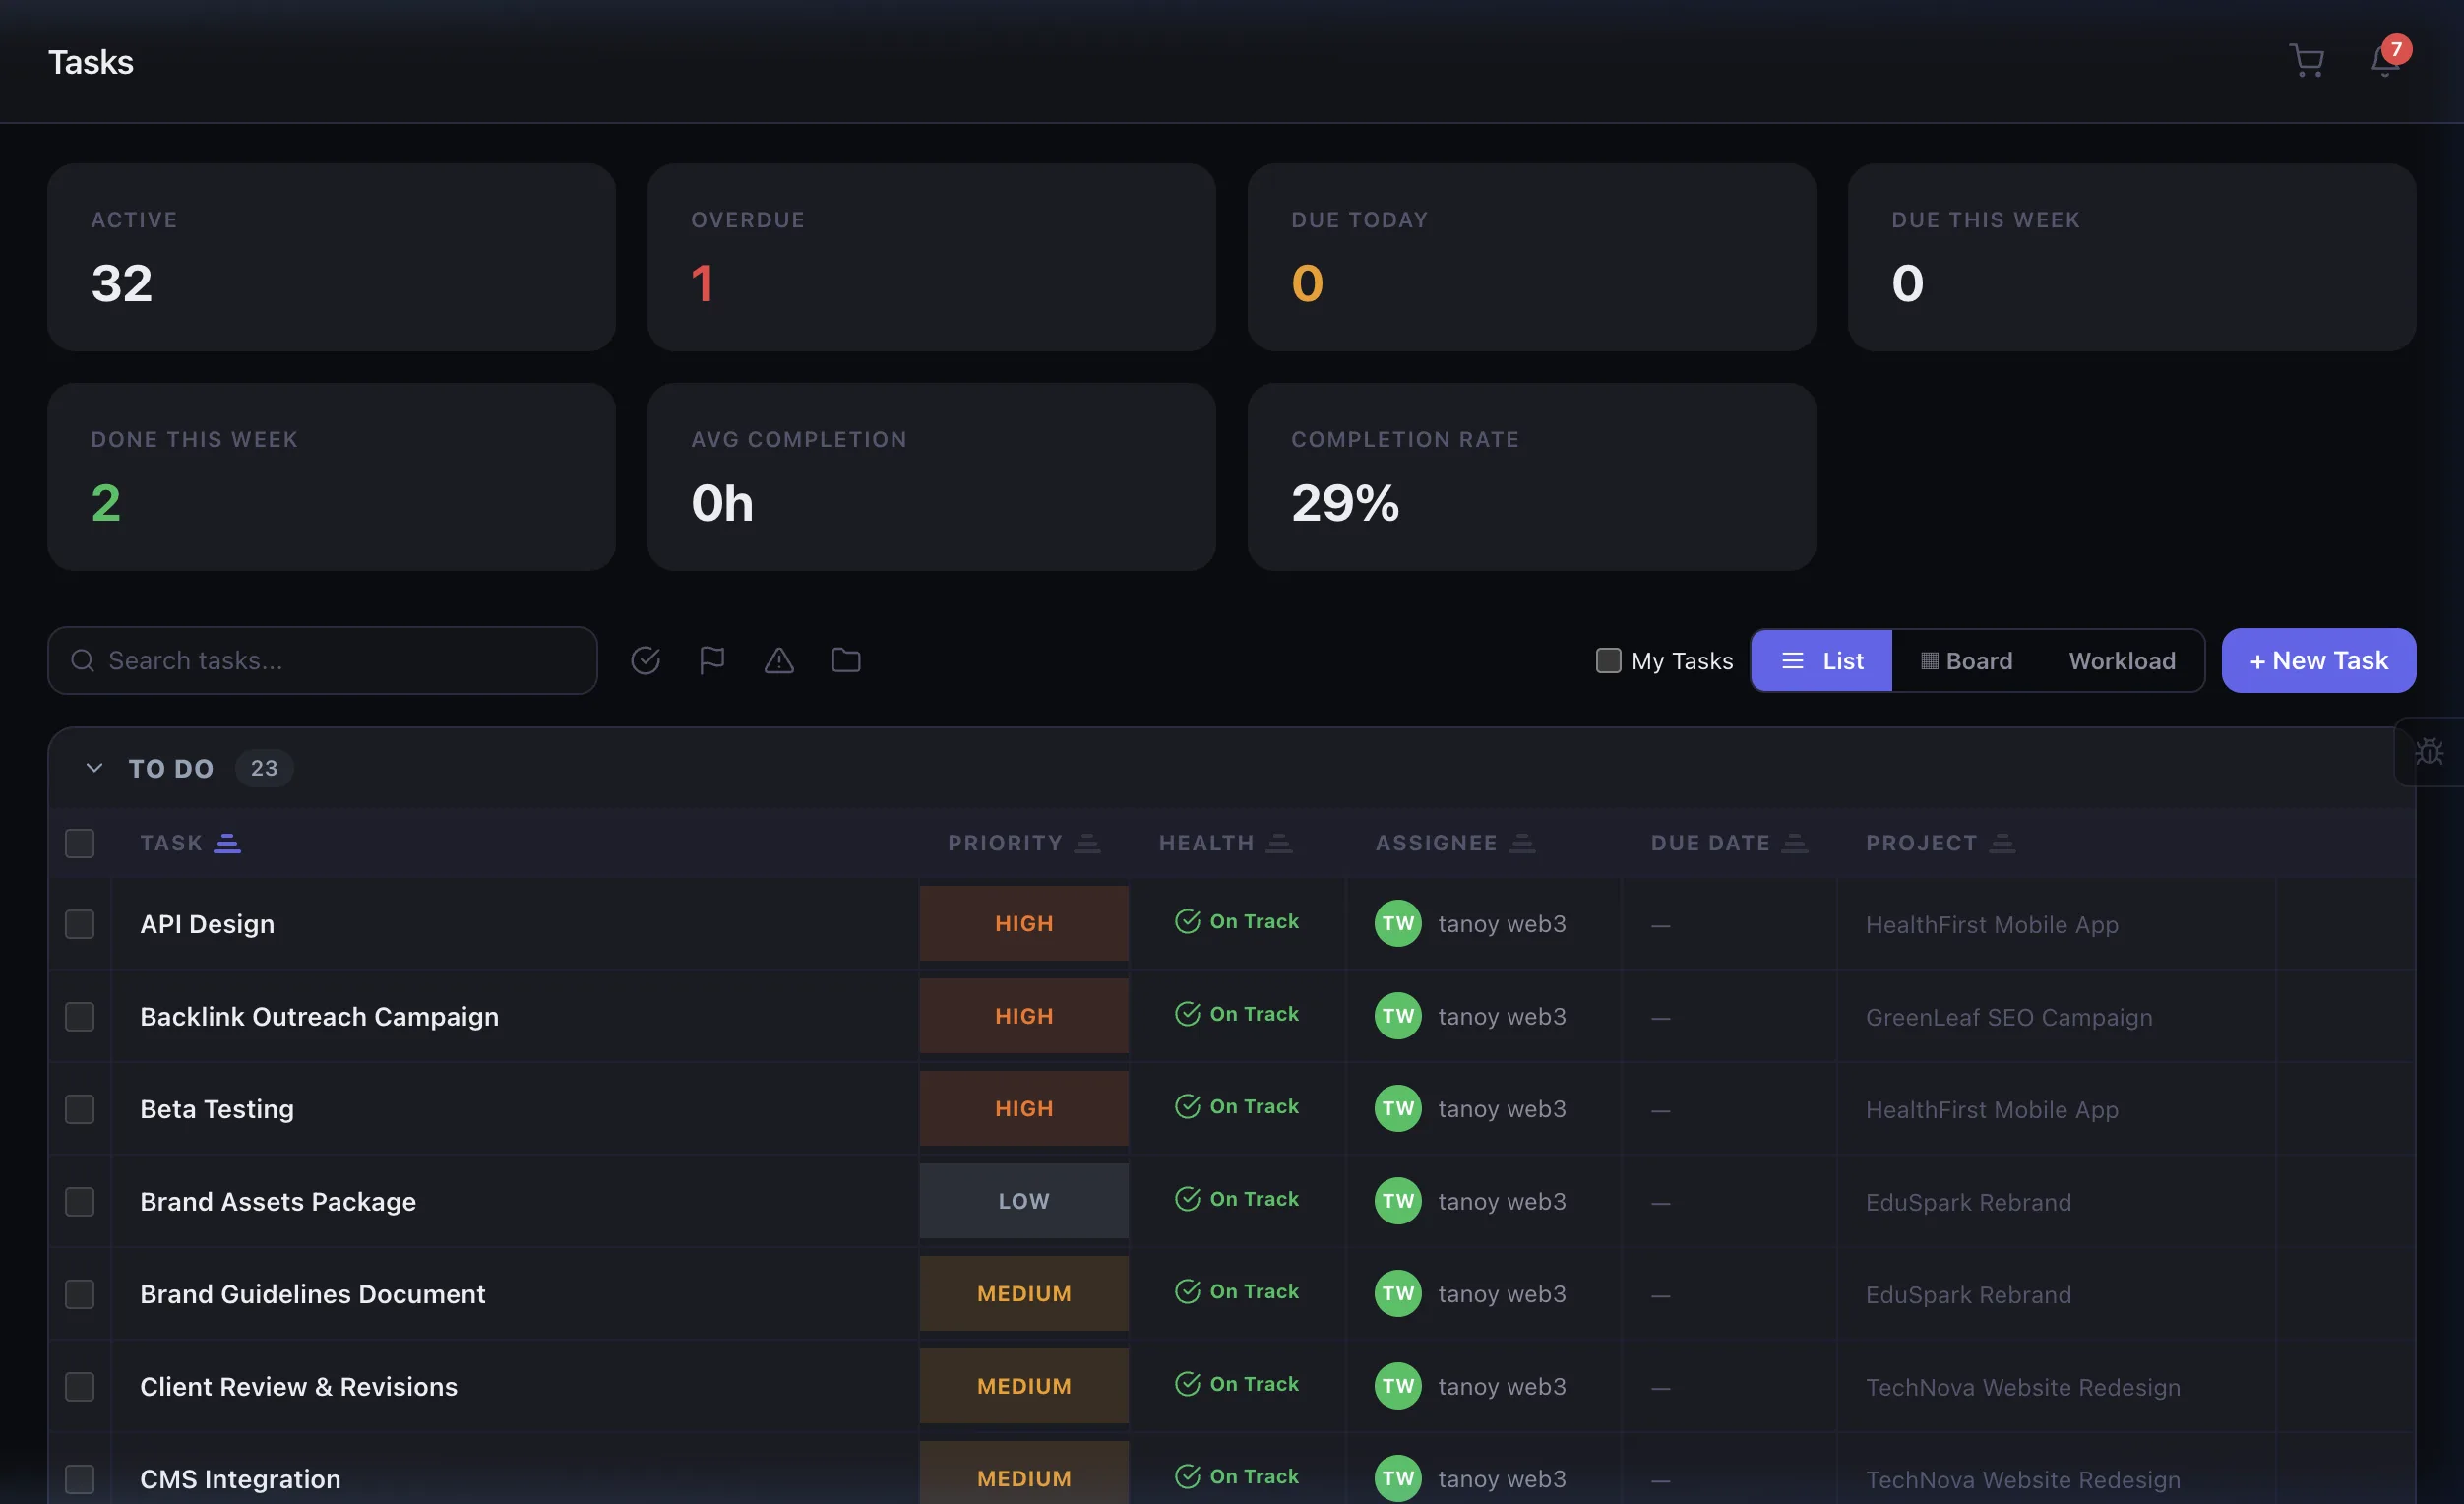
Team utilization, workload balance, and time tracking summaries.
Finance Teams
Invoice aging, payment trends, and exportable billing data.
Account Managers
Client-level project health and activity reporting.
Frequently asked questions
Revenue reports, project profitability, team utilization, time tracking summaries, invoice aging, client health overviews, and custom date-range comparisons — all with exportable charts.
Yes. Export any report to CSV or PDF. Revenue and time tracking data can also be exported to JSON for integration with accounting software or business intelligence tools.
Reports pull live data in real-time. Every time you open a report, it reflects the latest invoices, time entries, project statuses, and client health scores — no manual refresh needed.
Enterprise users can build custom report views with filtered date ranges, client segments, project groups, and team filters. Save report presets for quick access.
Related features
Stop using spreadsheets for agency analytics
Real-Time vs. Stale
Spreadsheets require manual updates. Eidoncore reports pull live data every time you open them — always current, always accurate.
Connected Data
Revenue, projects, tasks, and time are all connected. See how time logged on tasks impacts project budgets and client profitability — automatically.
Zero Setup Time
No formulas, no pivot tables, no vlookups. Reports are pre-built and ready to use from day one. Just open and explore.
Make smarter decisions with real data
Every metric your agency needs — revenue, projects, tasks, and team — in one dashboard.